Getting Started with OpenTelemetry
In this series of posts, I’ll be exploring OpenTelemetry and how it can help you improve the observability of your applications. I will focus on the tracing capabilities of OpenTelemetry, but I’ll also touch on metrics and logs - and specifically how they can be linked together to decrease the time to detect and resolve issues in your applications.
What is OpenTelemetry?
OpenTelemetry was born from the merger of two existing projects: OpenTracing and OpenCensus. It is a set of tools, APIs, and SDKs that allow you to instrument your applications to collect telemetry data. This data can then be used to generate metrics, logs, and traces.
The fundamentals of what OpenTelemetry is can be found on the official specification page](https://opentelemetry.io/docs/reference/specification/). The specification is a great place to start if you want to understand the concepts behind OpenTelemetry.
In short, the specification sets the rules for how the data is collected and how it is represented. The specification is then implemented by the different language-specific SDKs. The SDKs are the libraries that you will use to instrument your applications.
Signals
OpenTelemetry defines three different signals: metrics, logs, and traces. These signals are used to represent different aspects of your application’s behavior.
Most applications already generate logs. Logs are a good way to understand what is happening in your application, but they can be hard to parse and analyze. Metrics are a better way to understand the behavior of your application, but they are not always enough to understand the root cause of an issue. Traces are a great way to understand the flow of your application, but they can be hard to correlate with other signals.
These three signals are the holy trinity of observability. When linked together, they can help you understand the behavior of your application and detect and resolve issues faster, decreasing the support and maintenance costs of your applications.
Distributed Tracing
With Tracing you can follow the flow of a request through your application. This can help you understand what behavior was executed, how much time it took, and what resources were used. Even in the context of a single service, it can provide incredible value, but Tracing really shines when you have a distributed system.
With the advent of microservices, or generally in complex architectures with many different services involved, it can be hard to know all the services that are called in a single user-journey. Distributed tracing can help you understand the flow of a request through your system, even if it involves multiple services.
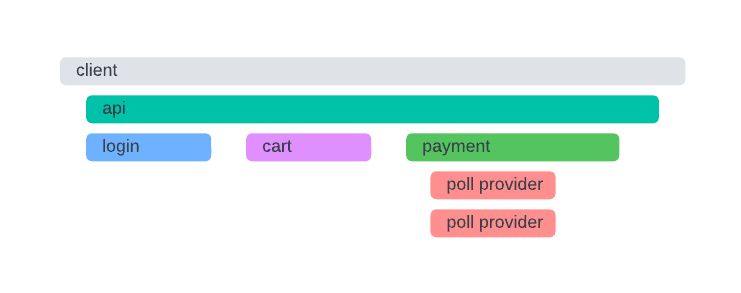
You may already be wondering what type of data needs to be collected to create such a visualization. In essence, a trace is a collection of spans. A span represents a single operation (unit of work) in your application.
A span can be a single method call, a database query, an HTTP request, etc. A trace is a collection of spans that are linked together to represent a single user journey.
But how can you have multiple services contributing to the same trace? How can you link spans from different services together? This is where context propagation comes into play.
Context Propagation
Context Propagation is the fundamental concept that powers distributed tracing. It allows you to link spans from different services together to create a trace.
OpenTelemetry defines two sub-concepts within context propagation: context and propagation. While context is the data that is passed between services, propagation is the mechanism that allows you to pass the context between services and processes, so it serializes and deserializes the context as needed to create what we call TraceContext.
The context is an abstract concept that is generically represented by a set of key-value pairs. However, it can be better understood by looking at a concrete example. By default, OpenTelemetry uses the W3C Trace Context specification to represent the context. There are other formats, such as B3 and Jaeger.
These are usually represented as HTTP headers, but they can also be represented as metadata in gRPC calls, or as message headers in a message queue. We’ll get into more detail on how you should choose a context format and how to handle propagation in several different scenarios in a future post.
Instrumentation
The first thing you need to know about instrumenting your application to extract these signals is that there are two different ways to do it: manual and automatic.
There is no silver bullet here, and you will end up using a combination of both depending on the services you manage. However, it is important to understand the differences between the two approaches.
Automatic Instrumentation
In most cases, this is where you should start to get the most value out of OpenTelemetry, in the least time possible. Automatic instrumentation is the process of instrumenting your application by using a library that automatically instruments your application for you.
If we have a Java application, this will be a Java agent. If we have a JavaScript/Node.js application, this will be a JavaScript file included during the run/execution phase. If we have a Python application, this will be a Python agent, and so on.
The main advantage of automatic instrumentation is that it is easy to get started with. In most cases, you just need to add a dependency to your application and you are good to go. The downside is that you may not get all the data you need, or you may get too much data. You may also not be able to customize the instrumentation to your needs.
For example, in Java you only need to download the Java agent JAR and add it to your application’s classpath like so:
java -javaagent:opentelemetry-javaagent.jar \
     -Dotel.service.name=your-service-name
     -jar my-service.jar
Or using environment variables:
export JAVA_TOOL_OPTIONS="-javaagent:path/to/opentelemetry-javaagent.jar"
export OTEL_SERVICE_NAME="my-service-name"
java -jar my-service.jar
We then have the possibility of adding configuration options to the agent to customize the instrumentation. For example, we can configure the agent to only instrument specific libraries, or to exclude specific libraries from being instrumented using the format -Dotel.instrumentation.[name].enabled=false:
java -javaagent:opentelemetry-javaagent.jar \
     -Dotel.service.name=my-service-name
     -Dotel.instrumentation.jdbc.enabled=false
     -jar my-service.jar
You can also find all available options, including context propagation and exporter formats, sampling and many other things in the Java agent configuration page.
Due to the nature of this type of instrumentation, be aware that there may be a performance impact - make sure you run load tests before and after this change, especially if you are using something like a Java agent.
Manual Instrumentation
Manual instrumentation is the process of instrumenting your application by using the OpenTelemetry SDKs directly. This is usually done by adding the SDKs as dependencies to your application and then using them to instrument your application.
The main advantage of manual instrumentation is that you have full control over what is instrumented and how. The downside is that it is usually more complex and time-consuming to get started with.
For example, in Java you need to add the following dependencies to your application:
dependencies {
    implementation 'io.opentelemetry:opentelemetry-api:<version>'
    implementation 'io.opentelemetry:opentelemetry-sdk:<version>'
    implementation 'io.opentelemetry:opentelemetry-exporter-otlp:<version>'
    implementation 'io.opentelemetry:opentelemetry-semconv:<version>-alpha'
}
The latest version of these libraries can be found on the OpenTelemetry GitHub releases page.
You can then use the SDK to create a tracer and start creating spans:
Span span = tracer.spanBuilder("my-span").startSpan();

try (Scope scope = span.makeCurrent()) {
    // do some work
    span.setAttribute("key", "value");
    span.addEvent("event");
    span.setStatus(Status.OK);
} finally {
    span.end();
}
You’ll also need some boilerplate code to configure the SDK and the exporter:
    Resource resource = Resource.getDefault()
        .merge(Resource.create(
            Attributes.of(ResourceAttributes.SERVICE_NAME, "my-service-name")
        ));

    SpanExporter spanExporter = OtlpGrpcSpanExporter
        .builder()
        .setEndpoint("http://localhost:4317") // this is the default for OTLP over gRPC
        .build();

    SdkTracerProvider sdkTracerProvider = SdkTracerProvider.builder()
        .addSpanProcessor(BatchSpanProcessor.builder(spanExporter).build())
        .setResource(resource)
        .build();

    // W3C format for context propagation
    TextMapPropagator propagator = W3CTraceContextPropagator.getInstance();
    // or you could use B3 (multi header format)
    // TextMapPropagator propagator = B3Propagator.injectingMultiHeaders();

    OpenTelemetry openTelemetry = OpenTelemetrySdk.builder()
        .setTracerProvider(sdkTracerProvider)
        .setPropagators(ContextPropagators.create(propagator))
        .buildAndRegisterGlobal();
I’ll leave the details of manual instrumentation for a future post, namely how to configure the SDK and the exporter, when we should create spans, how to propagate context, and how to integrate OpenTelemetry manual instrumentation with popular frameworks.
Later on, we’ll also talk about using OpenTelemetry Collector to offload the burden of exporting data to a backend, and how to take full advantage of a Tracing backend to achieve observability nirvana.