Context Propagation in OpenTelemetry
This is the second post in a series about OpenTelemetry. In the previous post, we introduced OpenTelemetry is and why it is important. In this post we will go over context propagation and how it works in OpenTelemetry.
While instrumenting a single service may be useful, the real power of OpenTelemetry comes from the ability to instrument multiple services and then correlate the data between them. This is done by propagating a context between services. This context contains information about the request, such as the trace ID, span ID, and other metadata. This allows the spans from multiple services to be correlated into a single trace, which can then be used to understand the flow of a request through the system.
How does it work?
One thing to note is that OpenTelemetry does not specify how the context is propagated. Instead, it provides a mechanism for injecting and extracting the context, and it is up to the user to decide how to do this. This allows OpenTelemetry to be integrated with a wide variety of frameworks and libraries, even if they do not support OpenTelemetry directly.
The most common way to propagate context is using HTTP headers. This is because HTTP is the most common protocol used for communication between services, however, we can use several other mechanisms, such as gRPC metadata, or even Kafka headers.
Common formats
OpenTelemetry supports several different context propagation formats, the most common ones are:
W3C Trace Context
The W3C Trace Context specification was created to standardize the propagation of tracing information across services. It defines a set of HTTP headers that can be used to propagate the context between the various nodes in a system.
The headers are traceparent and tracestate. The traceparent header contains the trace ID, span ID, and sampling state. The tracestate header can contain additional metadata about the Trace in the form of a small list of key-value pairs, and is mostly used to convey vendor-specific information.
The format for the traceparent header is as follows:
traceparent: {Version}-{TraceId}-{SpanId}-{TraceFlags}
Receiving an HTTP request with W3C Trace Context context propagation might look something like this:
GET /my-service HTTP/1.1
Host: myhost.com
traceparent: 00-0af7651916cd43dd8448eb211c80319c-b7ad6b7169203331-01
tracestate: abc=00f067aa0ba902b7,xyz=99f067aa0ba902b7
B3 (Zipkin)
The B3 format was born out of the need to propagate tracing information between services using Zipkin. It is now supported by several other tracing systems, such as Jaeger and AWS X-Ray. It was designed to be simple and easy to implement, and it is one of the most widely used formats for context propagation.
As an example, receiving an HTTP request with B3 multi-header context propagation might look something like this:
GET /my-service HTTP/1.1
Host: myhost.com
X-B3-TraceId: f102024f34f30692b676c13f47cbcf03
X-B3-SpanId: e2695f90dfd76b09
X-B3-Sampled: 1
The same request using B3 single-header would look like this:
GET /my-service HTTP/1.1
Host: myhost.com
b3: f102024f34f30692b676c13f47cbcf03-e2695f90dfd76b09-1
Where the format for the b3 header is as:
b3={TraceId}-{SpanId}-{SamplingState}
Choosing a format
You might be asking, how should I know what format best suits my needs? The answer mostly depends on the ecosystem you are working with.
If you own all the services in your system, you can just stick with the default format, W3C Trace Context. However, if you are integrating with other services that already publish tracing information, you might need to use a different format, such as B3. In the end, the goal is to have a consistent format across all services, so that the context can be propagated correctly and Traces can contain all the information needed to understand the flow of a request through the system.
For example, Istio (Kubernetes Service Mesh) uses B3 multi-header as the default format (Zipkin tracer), so if you or any other services in your ecosystem are using Istio, you should probably consider using B3 as well.
There are a few other proprietary formats, such as the ones from Lightstep and Datadog, but the goal of OpenTelemetry is to provide a vendor-neutral solution, so you should probably avoid using them. Most vendors of tracing backends already support the standard formats, so there is no need to tie your application to proprietary solutions.
Extracting and injecting context
By now you should have a better understanding of what context propagation is and how it works. Now, let’s see how we can use OpenTelemetry to extract and inject context.
Thankfully OpenTelemetry defines abstractions for extracting and injecting context, so we don’t need to worry about the details of each format while adding support for a specific library. Generically we just need a way to allow propagators to read (extract) and write (inject) the headers.
Injecting context on the client
The example below shows how we can add support to a specific Java HTTP client, in this case, AsyncHttpClient, to inject the context into the HTTP request headers:
Span span = getTracer().spanBuilder("get /my-endpoint")
    .setSpanKind(SpanKind.CLIENT)
    .startSpan();

try (Scope scope = span.makeCurrent()) {
    BoundRequestBuilder builder = asyncHttpClient.prepareGet("http://localhost:8080/my-service");
    ...
    getOpenTelemetry().getPropagators().getTextMapPropagator()
        .inject(Context.current(), builder, AsyncHttpClientTextMapSetter.INSTANCE);
    ...
} finally {
    span.end();
}
First, we get our instance of OpenTelemetry, which we can use to access the Propagators API. Then we call the getTextMapPropagator() method to get the TextMapPropagator for the current context propagation format. Finally, we call the inject() method, passing the current context, the object that will be used to inject the context, and a TextMapSetter that will be used to set the headers.
The TextMapSetter is an interface that defines a single method, set(), which receives the object that will be used to inject the context, the header key, and the header value. The TextMapSetter is responsible for setting the header on the object, and it is library-specific. For example, the TextMapSetter for AsyncHttpClient (specifically for BoundRequestBuilder) would look like this:
public class AsyncHttpClientTextMapSetter implements TextMapSetter<BoundRequestBuilder> {

    public static final AsyncHttpClientTextMapSetter INSTANCE = new AsyncHttpClientTextMapSetter();

    @Override
    public void set(@Nullable BoundRequestBuilder carrier, String key, String value) {
        carrier.addHeader(key, value);
    }
}
This is all you need to do to flow the context from the client to the server. The same concept applies to other libraries and frameworks, and they don’t even have to be HTTP-based! Here’s an example using Kafka headers to propagate context:
val record = ProducerRecord(topic, key, value)

openTelemetry.propagators.textMapPropagator.inject(Context.current(), record) { holder, headerName, headerValue ->
    holder?.headers()?.add(headerName, headerValue.toByteArray(Charsets.UTF_8))
}
Extracting context on the server
The same principles apply to the server side. The example below shows how we can extract the context using HttpServletRequest (Spring Boot):
// originalRequest is an instance of HttpServletRequest,
// added to the method signature in the Spring Boot controller method

Context extractedContext = openTelemetry.getPropagators().getTextMapPropagator()
    .extract(Context.current(), originalRequest, HttpServletRequestTextMapGetter.INSTANCE);
Here we get the TextMapPropagator for the current context propagation format, and then we call the extract() method, passing the current context, the object that contains the headers, and a TextMapGetter that will be used to get the headers.
The TextMapGetter is an interface that defines two methods, keys() and get(). The keys() method returns an Iterable of header keys, and the get() method receives the object that contains the headers and the header key, and returns the header value. The TextMapGetter is also library-specific. For example, the TextMapGetter for HttpServletRequest would look like this:
public class HttpServletRequestTextMapGetter implements TextMapGetter<HttpServletRequest> {

    public static final HttpServletRequestTextMapGetter INSTANCE = new HttpServletRequestTextMapGetter();

    @Override
    public Iterable<String> keys(HttpServletRequest carrier) {
        return Collections.list(carrier.getHeaderNames());
    }

    @Nullable
    @Override
    public String get(@Nullable HttpServletRequest carrier, String key) {
        return carrier.getHeader(key);
    }
}
Once we have the extracted context, we can use it to create a new Span:
try (Scope contextScope = extractedContext.makeCurrent()) {

    Span requestSpan = tracer.spanBuilder("Request to /my-endpoint")
        .setSpanKind(SpanKind.SERVER)
        .startSpan();

    try (Scope scope = requestSpan.makeCurrent()) {
        ...
    } finally {
        requestSpan.end();
    }
}
A note on SpanKind
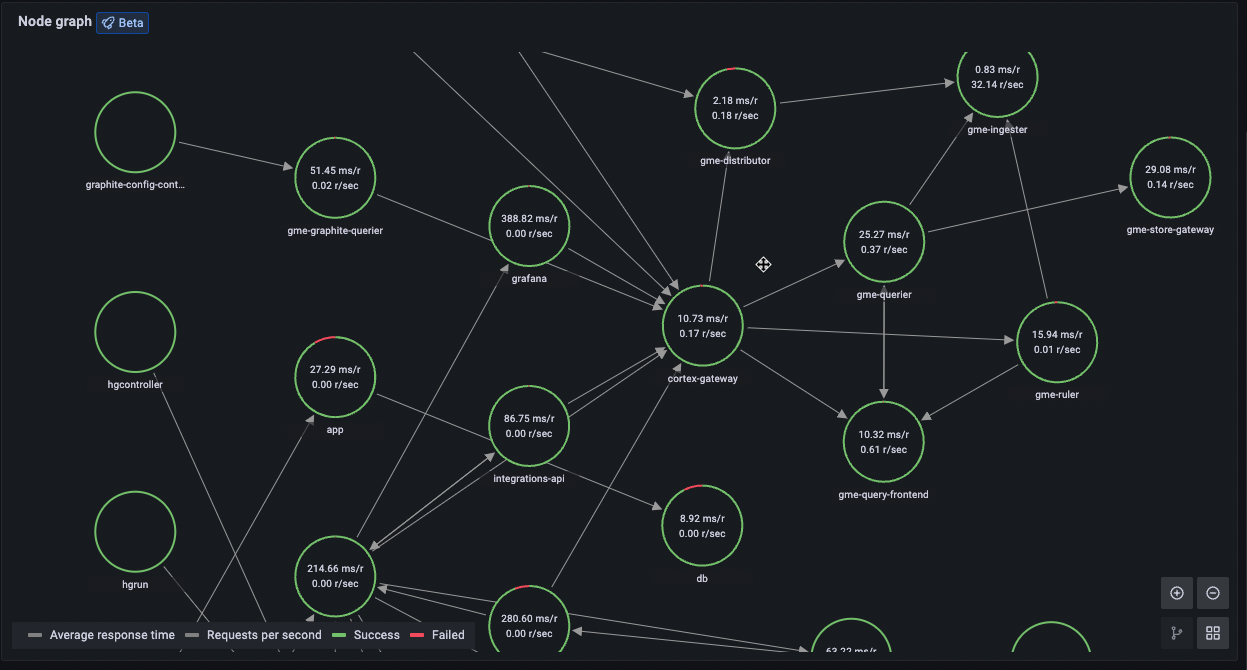
You may have noticed that we set the SpanKind to SERVER and CLIENT when creating the Span for the server side and client side respectively. This is important because it allows the tracing backend to differentiate between client and server spans, which is required by many tracing backends to generate service graphs/dependency graphs.
This is what a service graph looks like in Grafana Tempo (a tracing backend):